How big is the hospitality industry in 2026? Bigger than it has ever been. Travel and tourism contributed a record $11.6 trillion to global GDP in 2025, which works out to 9.8% of the world economy. The global hospitality market itself is projected to pass $5.8 trillion in 2026.
This report compiles 100 up-to-date hospitality industry statistics: global market size, sector-by-sector data, hotel technology adoption, guest experience benchmarks, luxury hospitality figures, country-level performance, and the trends shaping hotels, resorts, restaurants, and casinos in 2026.
Editor's top picks:
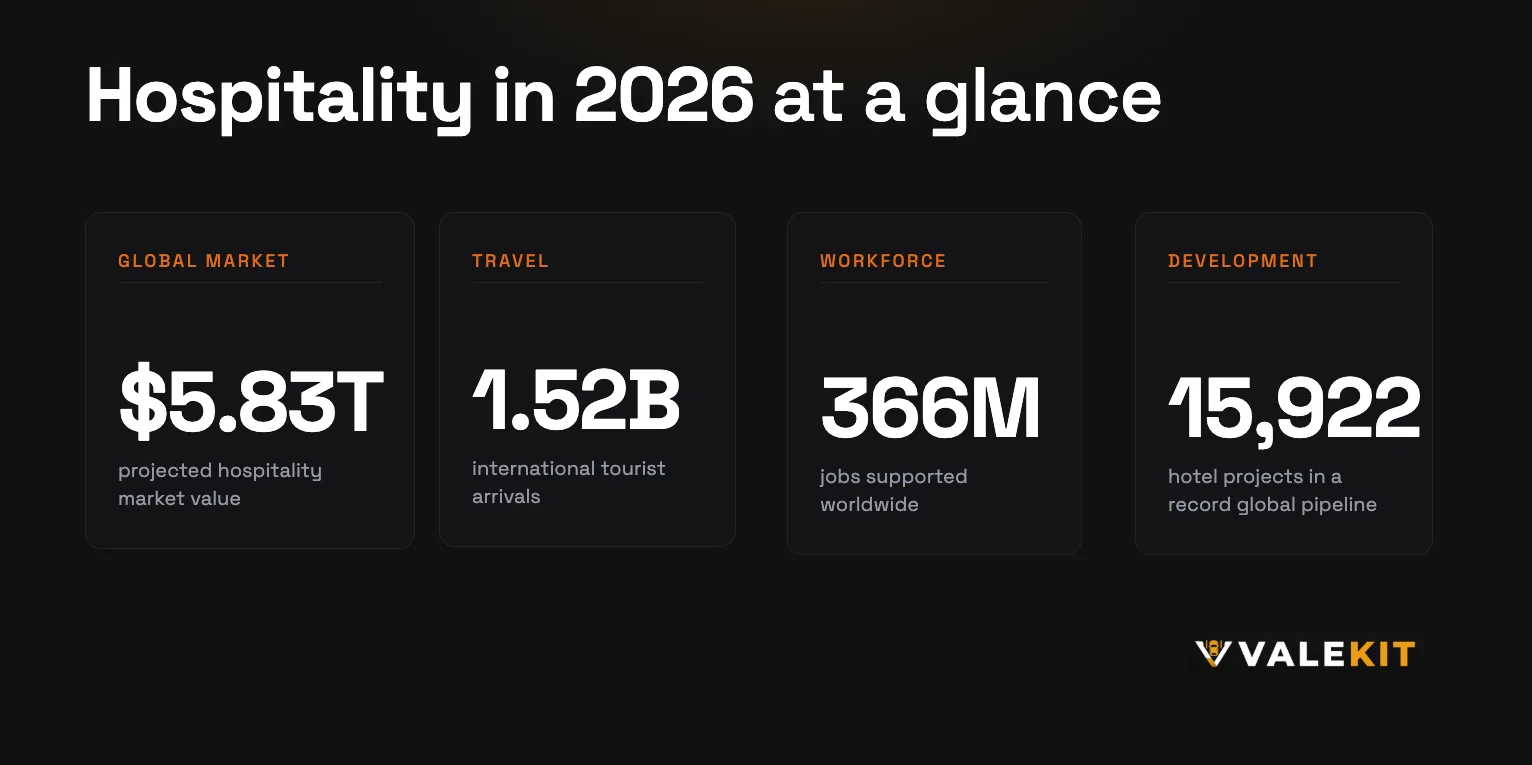
- Travel and tourism contributed a record $11.6 trillion to global GDP in 2025 and supported 366 million jobs. One in three net new jobs created worldwide came from this sector.
- 1.52 billion international tourists traveled in 2025, 4% above pre-pandemic levels
- The global hotel construction pipeline hit a record 15,922 projects / 2.44 million rooms entering 2026
- 70% of travelers now prefer an app or kiosk over the front desk at check-in
- The luxury hotel market will grow from $110.9 billion (2025) to $196.7 billion by 2033
- Hotel parking delivers a 60.2% average departmental profit margin, and valet parking technology is growing at a 15.6% CAGR, making it one of the fastest-digitizing corners of guest operations
Global Hospitality Industry Statistics
The hospitality industry entered 2026 from its best year on record. Demand is above pre-pandemic levels on every continent, supply is expanding at record pace, and the sector keeps out-growing the global economy.
- The global hospitality market reached $5.52 trillion in 2025 and is projected to hit $5.83 trillion in 2026 (5.6% growth), on its way to $7.48 trillion by 2030.
- Travel and tourism contributed a record $11.6 trillion to global GDP in 2025 (9.8% of the world economy) and is forecast to reach ~$12 trillion, or 9.9% of global GDP, in 2026.
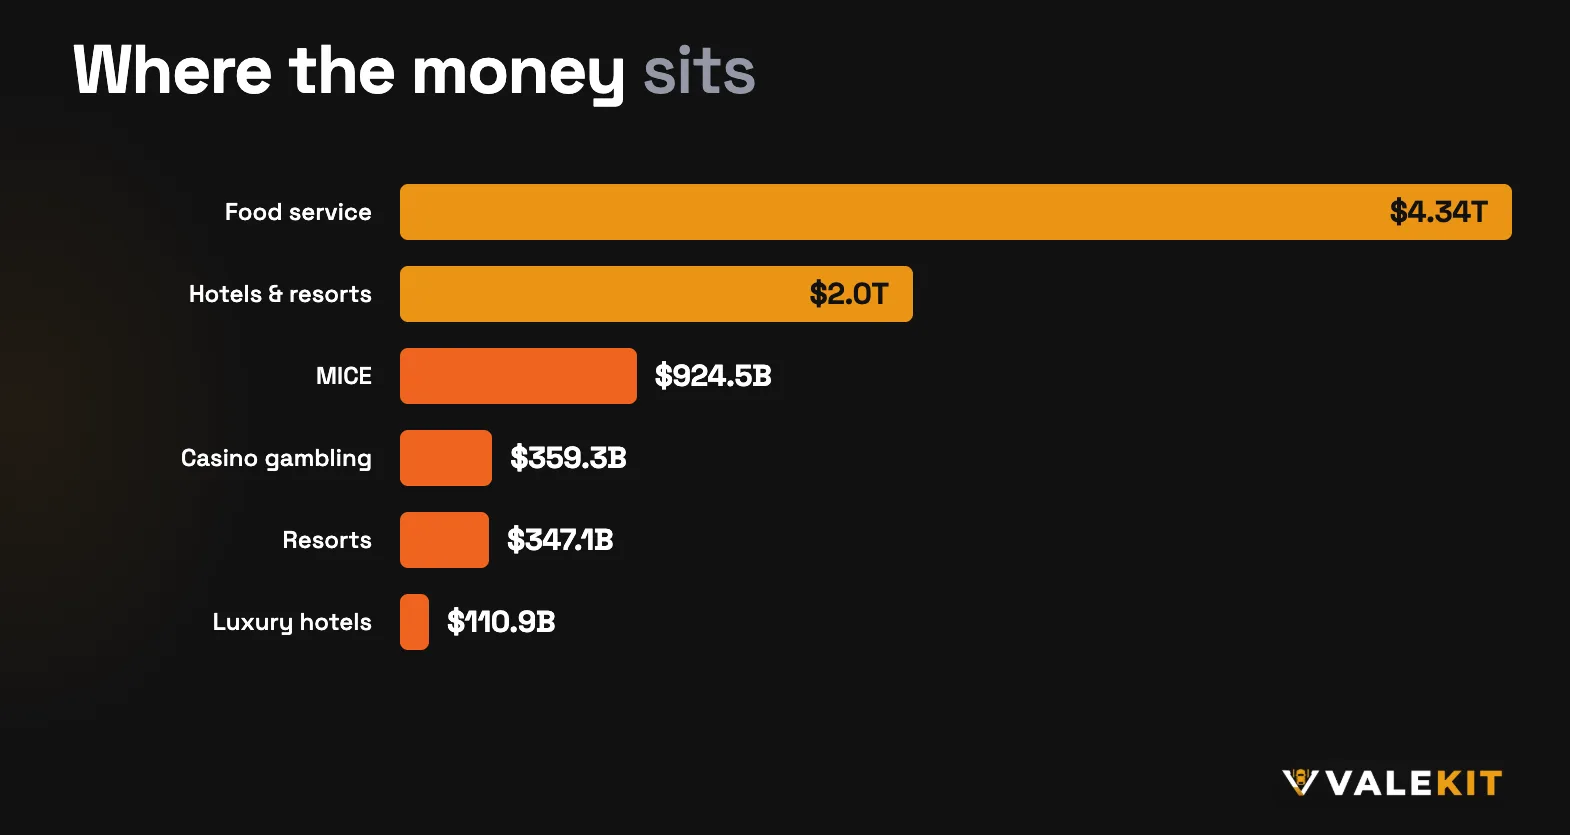
- The global hotels and resorts industry alone is worth $2.0 trillion in 2026, spread across roughly 339,000 businesses, with an average profit margin of 13.6%.
- Worldwide hotel revenue is forecast at $492.4 billion in 2026, rising to $638.4 billion by 2030. By 2030, 81% of hotel revenue will be generated through online sales.
- Branded and chain-affiliated properties control 61.9% of the global hospitality market, and leisure travelers account for 52.6% of demand.
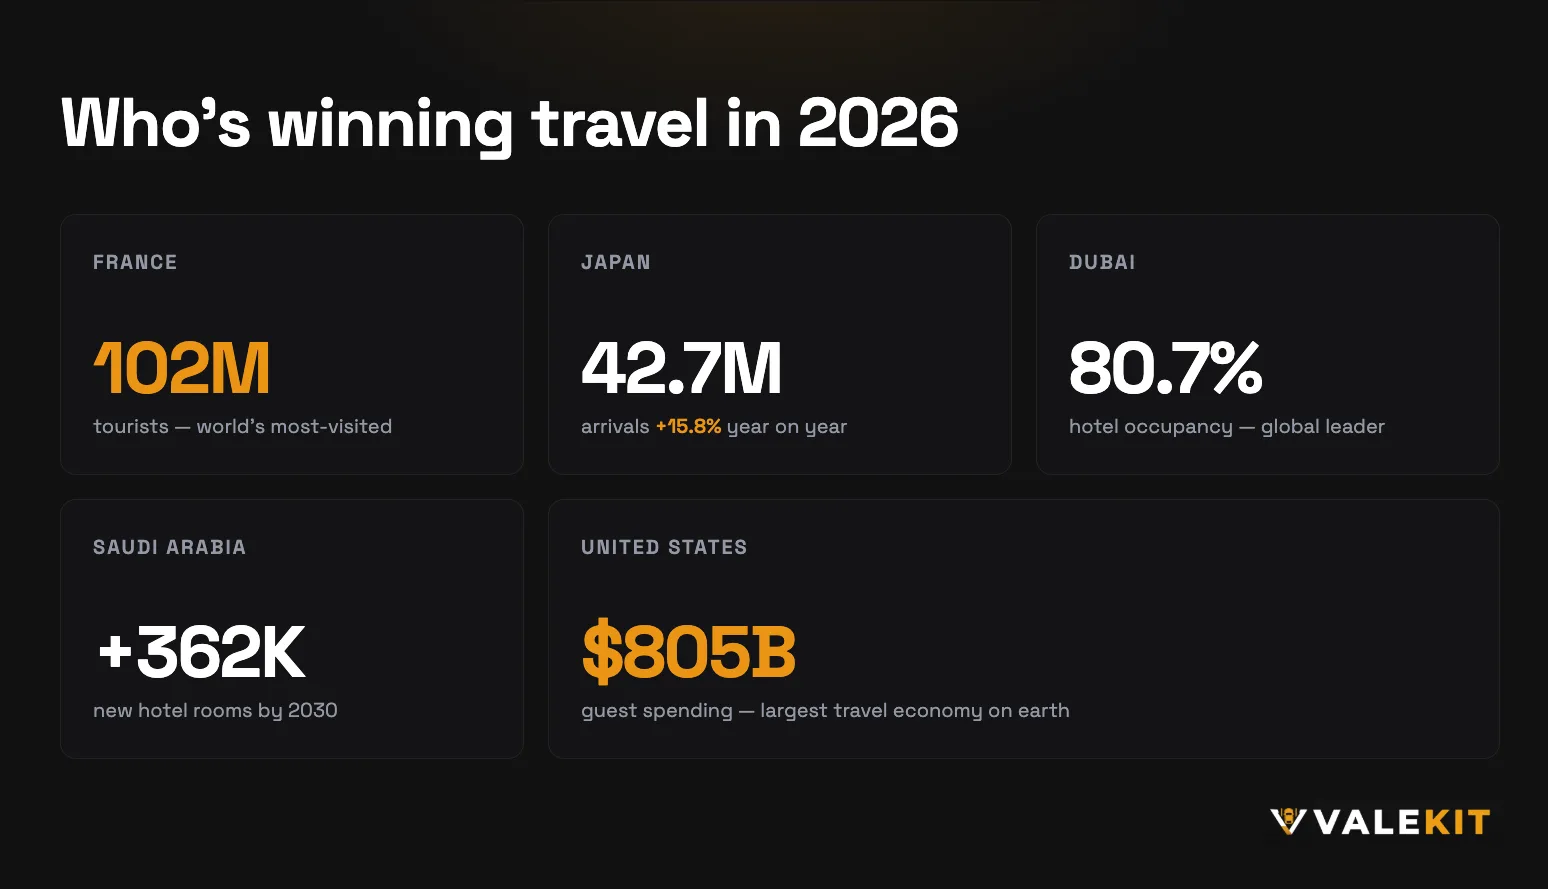
- 1.52 billion international tourists traveled in 2025, up 4% year over year and 4% above 2019.
- International tourism receipts reached $1.9 trillion in 2025, with total tourism export revenues estimated at $2.2 trillion.
- By region, 2025 arrivals were led by Europe (793 million), Asia-Pacific (331 million), the Americas (218 million), the Middle East (~100 million), and Africa (81 million, the fastest-growing at +8%).
- International tourism is expected to grow another 3-4% in 2026.
- Travel and tourism supported 366 million jobs in 2025, or 10.9% of global employment. One in three net new jobs created worldwide came from the sector.
- The sector is projected to add 91 million new jobs by 2035 but faces a 43 million worker shortfall, with hospitality alone short 8.6 million workers (18% below required staffing). That labor gap is a core reason hotels are automating routine operations, from check-in to parking, faster than ever.
- There are an estimated 187,000+ hotels worldwide, with room-stock estimates ranging from 17.5 million to over 33 million depending on census methodology.
- The global hotel construction pipeline hit a record 15,922 projects / 2,437,354 rooms at the end of 2025, with 2,617 new hotels forecast to open in 2026.
- Hotel performance growth is normalizing: 2026 RevPAR is forecast at +4.4% in Asia-Pacific, +1.4% in Europe, and +0.6% in the US.
- More than 90% of hotel investors expect to maintain or increase their hotel exposure in 2026.
Key takeaway: demand is at record highs while staffing sits about 18% below what the industry needs. The hotels winning in 2026 are closing that gap with technology.
Hospitality Industry Statistics by Sector
Hospitality is not one market. It spans hotels, resorts, restaurants, casinos, vacation rentals, and event venues, each with its own economics.
- The US hotel market is worth an estimated $280.6 billion in 2025, projected to reach $395.7 billion by 2030 (7.1% CAGR).
- 2025 marked the first non-recessionary RevPAR decline ever recorded in the US hotel industry (-0.3%); 2026 is forecast to recover modestly at +0.6%.
- US hotel guest spending reached a projected $777.3 billion in 2025, up 4% from 2024's record.
- There are 49,785 hotels and motels operating in the US with roughly 5.6 million rooms.
- The global luxury hotel market is valued at $110.87 billion in 2025, projected to reach $196.7 billion by 2033. Luxury hotel chains hold 65.2% of it.
- The luxury chain-scale construction pipeline hit a record 1,328 projects (252,544 rooms) at the end of 2025, up 8% year over year.
- The global resort market was estimated at $347.1 billion in 2024, projected to reach $945.4 billion by 2030. Beach resorts are the largest segment at $115.9 billion.
- The US restaurant industry was projected to hit $1.5 trillion in sales in 2025, employing 15.9 million people across more than 1 million outlets. It remains America's second-largest private-sector employer.
- The global food service market is valued at $4.34 trillion in 2025, forecast to reach $7.61 trillion by 2030.
- 81% of consumers say they want to dine on-premises at table-service restaurants more often.
- US commercial gaming revenue hit an all-time record of $71.92 billion in 2024, the fourth straight record year. Land-based slots and table games alone set a record $49.78 billion.
- The global casino gambling market is worth $359.3 billion in 2026, projected to reach $624 billion by 2031.
- Airbnb booked 491 million+ nights and experiences in 2024, with gross booking value of nearly $82 billion.
- The global short-term vacation rental market is expected to reach $362.4 billion by 2033. Analysts call 2026 "the best year to invest in short-term rentals since 2021."
- The global MICE market will reach $924.5 billion in 2025 and $1.35 trillion by 2030. Business events generated $1.3 trillion in direct spending in 2025, 12.2% above 2019 levels.
Key takeaway: every high-touch sector is growing, and hotels, casinos, fine dining, and event venues all share the same operational choke point: high guest volumes arriving by car at a physical front door.
Hospitality Technology & Digitization Statistics
Hospitality's digital transformation has moved from the booking engine to the property itself. Booking went online first. Now the on-property experience (check-in, room keys, payments, and parking) is digitizing at the same pace.
Online & mobile booking
- OTAs narrowly beat hotels' own websites in 2024 gross bookings, at $266 billion vs $262 billion, but hotel direct websites are forecast to overtake OTAs as the dominant digital channel by 2030.
- Mobile apps now account for 61.45% of the online accommodation booking market, which is projected to grow from $361.5 billion in 2026 to $485 billion by 2031.
- By 2030, 81% of all hotel revenue is expected to come through online sales.
Property management & smart hospitality
- The hospitality property management software (PMS) market is worth $1.73 billion in 2026, heading to $2.44 billion by 2031. Cloud-based PMS already holds 64.9% of the market.
- The broader smart hospitality market, meaning connected and automated hotel operations, is valued at $39.2 billion in 2025 and projected to reach $197.2 billion by 2033.
AI & automation
- 98% of hoteliers used AI across operations in the past six months, and 92% are optimistic about AI in hospitality.
- 82% of hospitality technology decision-makers expect AI usage to increase within the next year, and 85% plan to allocate at least 5% of IT budget to AI in 2026.
- The AI-in-hospitality market is growing at ~58% per year, from $0.37 billion in 2026 to a projected $2.28 billion by 2030.
- 58% of guests believe AI can improve their hotel stay, and 70% find chatbots helpful for simple inquiries.
- 74% of travelers are interested in hotels using AI to deliver personalized offers and services.
Contactless check-in & digital room keys
- 70% of travelers say they're likely to use an app or kiosk to check in instead of the front desk, rising to 82% among Gen Z.
- At kiosk-enabled US hotels, 30% of reservations are already checked in via kiosk. Guests who self-check-in are 3x more likely to purchase upsells and generate about 70% more upsell revenue.
- 80% of travelers prefer hotels with a completely automated front desk or self-service technology.
- 96% of hoteliers are investing in contactless technology, and 73% of travelers want hotels that minimize physical touchpoints.
- 54% of travelers want contactless check-in and checkout adopted permanently, and 34% want their phone to be their room key.
- The hotel mobile key market is valued at $1.8 billion in 2025, forecast to reach $5.2 billion by 2034.
QR codes & mobile payments
- Digital wallets accounted for 56% of global e-commerce value and 33% of in-person point-of-sale value in 2025, with over $13.8 trillion in combined spending.
- QR codes work best as an operations layer, not a menu replacement. 81% of US diners still prefer physical menus, yet QR-triggered workflows (payments, retrieval requests, feedback) have become standard in hotels, valet stands, and venues.
Digital valet & smart parking
The same digitization wave has reached the first and last touchpoint of the guest journey: the parking lane. Guest arrival is the part of the journey that stayed analog the longest, running on paper tickets, walkie-talkies, and cash tips. That is now changing, and valet operations software is the category driving it.
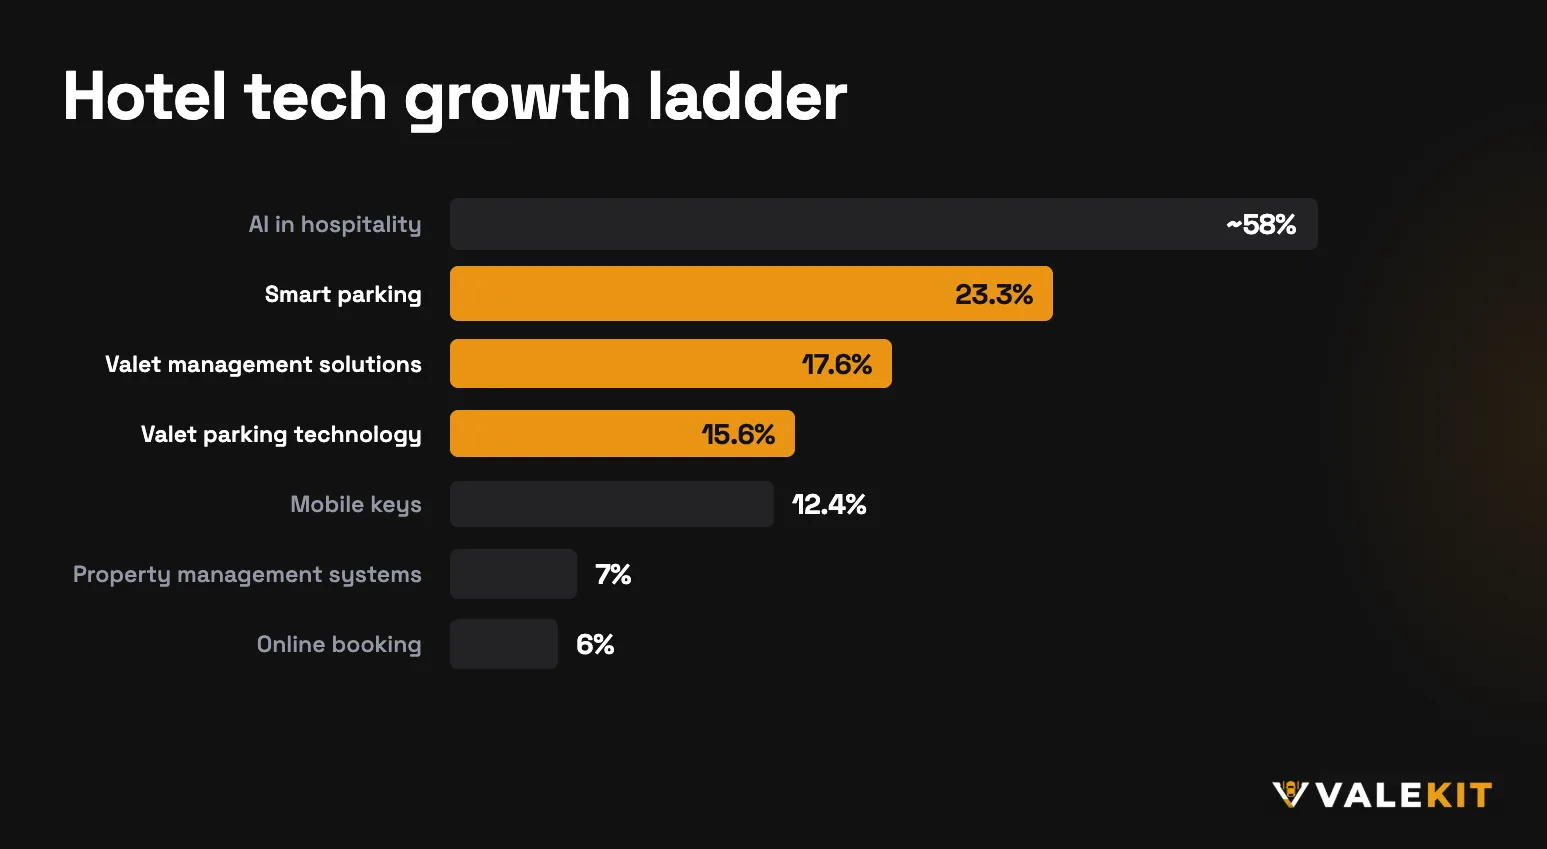
- The global smart parking systems market is valued at $10.22 billion in 2025 and projected to reach $53.38 billion by 2033 (23.3% CAGR).
- The parking management market is estimated at $6.19 billion in 2026, growing to $9.58 billion by 2031. Cloud-based parking software is the fastest-growing deployment at 11.1% CAGR.
- A second industry estimate puts parking management at $7.22 billion in 2025, reaching $12.41 billion by 2030 (11.4% CAGR).
- The US parking management market alone is forecast to nearly triple, from $5.2 billion (2024) to $15.1 billion by 2030.
- The global valet parking services market is valued at $4.54 billion in 2025, projected to reach $6.27 billion by 2035. Hotels are the largest buyer at 26% of the market, followed by restaurants at 18%.
- A broader-scope estimate values valet parking services at $5.31 billion in 2026, growing to $14.76 billion by 2035 (12% CAGR).
- Valet parking technology, the software layer that replaces paper valet tickets with SMS-based check-in and retrieval, is a $1.63 billion market in 2025, projected to reach $6.95 billion by 2035 at a 15.6% CAGR. That is faster growth than hotel PMS, mobile keys, or booking tech.
- The valet parking software segment specifically reached $478.9 million in 2024 and is projected to hit $1.19 billion by 2033 (10.7% CAGR).
- Valet parking management solutions were a $330.7 million market in 2025, projected to reach $1.12 billion by 2033 (17.6% CAGR), with North America the largest region.
- The autonomous valet parking system market is expected to grow from $425.5 million in 2025 to $1.5 billion by 2034.
- Hotel parking revenue per occupied room grew 20.7% between 2019 and 2022, with parking averaging 3.1% of total hotel revenue at a 60.2% average departmental profit margin. Few services a hotel operates carry a higher margin.
- Roughly 60% of full-service hotels and ~90% of luxury hotels already offer EV charging, which is reshaping parking layouts and valet workflows.
Key takeaway: booking digitized in the 2010s, check-in is digitizing now, and parking/valet is the next frontier, growing at 15-23% CAGR. That's faster than almost any other hotel tech category.
Hotel Guest Experience Statistics
Guest experience is where hospitality's revenue is actually decided. The data below covers what guests expect, how fast satisfaction collapses when arrival goes wrong, and what great experience is worth in dollars.
- 71% of consumers expect personalized interactions, and 76% get frustrated when they don't happen. Personalization done well drives a 10-15% revenue lift.
- 61% of consumers will spend more for a customized experience, but only 23% of hotel guests report actually receiving high personalization.
- 93% of travelers are willing to share personal data to improve their stay, and about 80% say personalized amenities make them most likely to return.
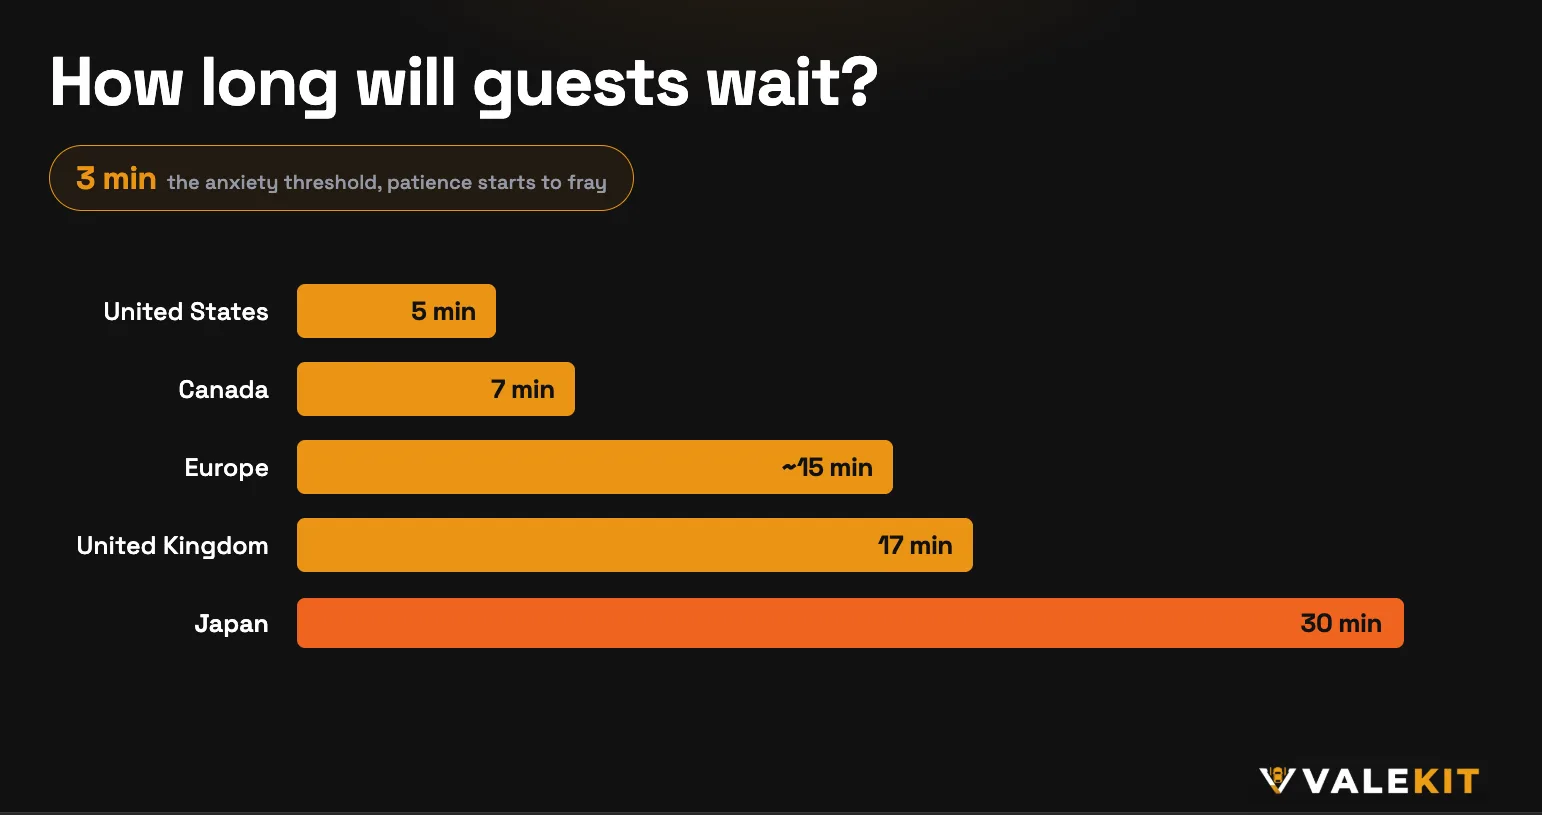
- American guests start feeling anxious after just 3 minutes of waiting at check-in, and satisfaction drops roughly 50 points on a 1,000-point scale once the wait passes 5 minutes.
- Wait tolerance varies by nationality: US guests around 5 minutes, Canadians 7, most Europeans 15, UK guests 17, and Japanese guests 30.
- 66% of travelers are willing to spend more with a hotel if wait times are reduced.
- When a problem occurs during a stay, including arrival and check-in disputes, guest satisfaction plunges 217 points on a 1,000-point scale.
- Arrival friction often starts before the lobby. Drivers spend an average of 17 hours a year searching for parking (about $345 per driver in wasted time and fuel), and 63% have avoided a destination entirely because of parking challenges. For hotels, casinos, and restaurants, a slow valet retrieval process is a satisfaction problem the guest experiences twice: once at arrival and again at departure.
- 81% of travelers always or frequently read reviews before booking, 52% would never book a hotel with no reviews, and a 1-point increase in a hotel's online reputation score drives up to +1.42% RevPAR. Arrival moments (valet, doorman, front desk) are among the most-mentioned themes in negative reviews.
- Major hotel loyalty programs reached roughly 675 million combined memberships in 2024 (+14.5% YoY), and members spend 22.4% more than non-members. Yet 82% of loyalty members report friction with current programs, starting with lengthy check-in.
Key takeaway: satisfaction is won or lost in minutes at arrival. Guests tolerate a 3-5 minute wait before scores collapse, and 66% will pay more to avoid waiting. That math applies to every queue a property runs: front desk, concierge, and the valet lane.